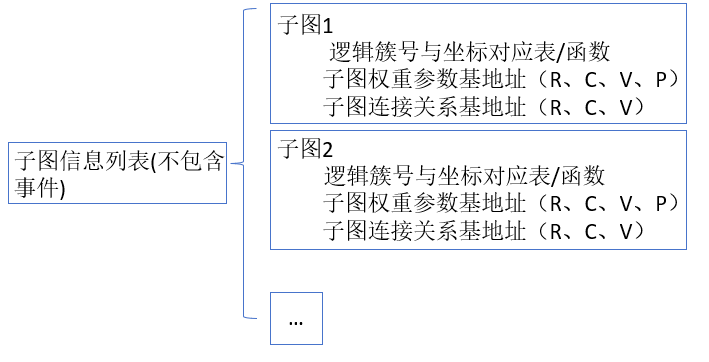
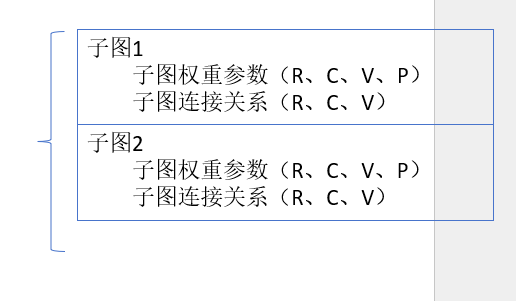
Description of Connection Subgraph Resources in BCE Architecture
目前我这边认为我们三(庭頫,我,晓文助理)要先弄清楚任务分配:
程序流程:
用户输入 -> 神经元分配 -> 分簇 -> 定簇(簇定位) -> 数据结构处理转换 -> 加载 -> BCE调度 -> BCE计算
对这些步骤的具体操作, 我就我目前知道的情况做了一个I/O表,但我怕我理解有偏差,我们就一起过一遍。
Step 1: 神经元分配
Input:用户输入,调用 n 个神经元,以及这n个神经元的连接信息和连接权重。
Target: 将用户的Request映射到具体的神经元上。
Output: Unkown
Step 2: 分簇
Input:n个neurons的id, 连接关系,权重。(以及其他一些参数)
Target: 将n个neurons根据一些算法(如借鉴上周四提到的Loihi核心优化映射算法,或者考虑其他算法,比如层次聚类算法,基于学习的聚类算法,以及进化算法等),划分成GNCs.
Output: GNCs
- GNC的设计参数
- 种群记录项 Epop
- 神经元数量 N
- Population个数 P
- 权重weight W
- 连接关系矩阵 C
- GNC的设计约束会在转换过程中不断变化
其中有部分参数是用来评估分簇性能的。
Step 3:定簇(簇定位)
Input:上一步的输出(即GNCs)
Target: 尝试不同的空间填充曲线HSC等,或深度学习等方法,用上周四的评测代码(例)对算法进行评测。
import matplotlib.pyplot as plt
import numpy as np
class InteractivePlot:
def __init__(self, grid_size=8):
self.grid_size = grid_size
self.fig, self.ax = plt.subplots()
self.points = np.array([(i, j) for i in range(grid_size) for j in range(grid_size)])
self.lines = []
self.temp_line = None
self.cid = self.fig.canvas.mpl_connect('button_press_event', self.onclick)
def plot_grid(self):
self.ax.plot(self.points[:, 0], self.points[:, 1], 'o', color='blue')
self.ax.set_xlim(-1, self.grid_size)
self.ax.set_ylim(-1, self.grid_size)
self.ax.set_aspect('equal')
plt.grid(True)
def onclick(self, event):
if event.inaxes != self.ax:
return
ix, iy = int(round(event.xdata)), int(round(event.ydata))
if self.temp_line is None:
self.temp_line = [ix, iy]
else:
self.temp_line.extend([ix, iy])
self.lines.append(self.temp_line)
self.ax.plot([self.temp_line[0], self.temp_line[2]],
[self.temp_line[1], self.temp_line[3]], 'r-')
self.fig.canvas.draw()
self.temp_line = None
def run(self):
self.plot_grid()
plt.show(block=True)
def get_lines(self):
return np.array(self.lines)
def calculate_distances(lines_array, grid_size=8):
num_points = grid_size * grid_size
points = np.zeros((num_points + 100, 2), dtype=int) # Add extra space for interpolated points
distances = np.full((num_points + 100,), np.inf) # Same here
points[0] = (0, 0)
distances[0] = 0
max_index = 0
for i, line in enumerate(lines_array):
points[i + 1] = (line[2], line[3])
distances[i + 1] = np.linalg.norm(np.array([0, i]) - points[i + 1])
max_index = i + 1 # store the max index used
# 计算线性插值
if i < len(lines_array) - 1:
next_point = (lines_array[i + 1][2], lines_array[i + 1][3])
for a in np.arange(0.25, 1, 0.25):
interp_point = points[i + 1] + a * (next_point - points[i + 1])
interp_index = i + 1 + int(a * 4)
if interp_index < len(distances): # Avoid out of bounds
distances[interp_index] = np.linalg.norm(np.array([0, i + a]) - interp_point)
max_index = max(max_index, interp_index) # Update max index
return points[:max_index + 1], distances[:max_index + 1] # Only return used points and distances
def plot_heatmap(points, distances, grid_size=8):
heatmap_size = 58
heatmap = np.full((heatmap_size, heatmap_size), np.inf)
# mapping to bigger grid
scale_factor = heatmap_size // (grid_size - 1)
for i, point in enumerate(points):
x, y = point * scale_factor
heatmap[x:x + 4, y:y + 4] = distances[i] # fill 4x5 grid
# interpolate the other grids
for x in range(heatmap_size):
for y in range(heatmap_size):
if np.isinf(heatmap[x, y]):
valid_neighbors = []
for dx in [-1, 0, 1]:
for dy in [-1, 0, 1]:
nx, ny = x + dx, y + dy
if 0 <= nx < heatmap_size and 0 <= ny < heatmap_size and not np.isinf(heatmap[nx, ny]):
valid_neighbors.append(heatmap[nx, ny])
if valid_neighbors:
heatmap[x, y] = np.mean(valid_neighbors)
# if not rotate
# plt.imshow(heatmap, cmap='hot', interpolation='nearest')
# plt.colorbar()
# plt.title("Heatmap of Distances")
# plt.show(block=True)
heatmap_rotated = np.rot90(heatmap)
plt.imshow(heatmap_rotated, cmap='hot', interpolation='nearest')
plt.colorbar()
plt.title("Heatmap of Distances (Rotated 90° CCW)")
plt.show(block=True)
def plot_heatmap_b(lines_array):
# Assuming lines_array is an Nx4 array, where N is the number of points, we only care about the x and y coordinates
grid_size = 256
heatmap = np.zeros((grid_size, grid_size))
num_points = len(lines_array)
for i in range(num_points):
for j in range(i):
# Get Px and Py
px = (lines_array[i][0], lines_array[i][1])
py = (lines_array[j][2], lines_array[j][3])
# Calculate Euclidean distance
distance = np.linalg.norm(np.array(px) - np.array(py), ord=2)
distance = np.round(distance, 5)
# Every point 4x4 grid
start_x, start_y = i * 4, j * 4
end_x, end_y = start_x + 4, start_y + 4
heatmap[start_x:end_x, start_y:end_y] = distance
# plot
plt.figure(figsize=(10, 10))
plt.imshow(heatmap, cmap='hot', interpolation='nearest')
plt.colorbar()
plt.title("Heatmap b of Distances")
plt.gca().invert_yaxis()
plt.show(block=True)
average_temperature = np.mean(heatmap)
print(f"The average temperature of the heatmap is: {average_temperature:.5f}")
def get_user_choice():
custom = input("Would you like to customize the lines data? (y/n): ")
if custom.lower() == 'n':
print("Select the default pattern:")
print("1: Hilbert Space Curve (HSC)")
print("2: Zigzag")
print("3: Circle")
print("4: Z-Order")
choice = input("Enter your choice (1, 2, 3, or 4): ")
return int(choice)
return 0
def generate_lines_array(choice):
if choice == 0: # Tester
return np.array([[0, 0, 1, 0]])
if choice == 1: # Hilbert Space Curve
# Placeholder for actual HSC points
return np.array([[0, 0, 0, 1],
[0, 1, 1, 1],
[1, 1, 1, 0],
[1, 0, 2, 0],
[2, 0, 3, 0],
[3, 0, 3, 1],
[3, 1, 2, 1],
[2, 1, 2, 2],
[2, 2, 3, 2],
[3, 2, 3, 3],
[3, 3, 2, 3],
[2, 3, 1, 3],
[1, 3, 1, 2],
[1, 2, 0, 2],
[0, 2, 0, 3],
[0, 3, 0, 4],
[0, 4, 1, 4],
[1, 4, 1, 5],
[1, 5, 0, 5],
[0, 5, 0, 6],
[0, 6, 0, 7],
[0, 7, 1, 7],
[1, 7, 1, 6],
[1, 6, 2, 6],
[2, 6, 2, 7],
[2, 7, 3, 7],
[3, 7, 3, 6],
[3, 6, 3, 5],
[3, 5, 2, 5],
[2, 5, 2, 4],
[2, 4, 3, 4],
[3, 4, 4, 4],
[4, 4, 5, 4],
[5, 4, 5, 5],
[5, 5, 4, 5],
[4, 5, 4, 6],
[4, 6, 4, 7],
[4, 7, 5, 7],
[5, 7, 5, 6],
[5, 6, 6, 6],
[6, 6, 6, 7],
[6, 7, 7, 7],
[7, 7, 7, 6],
[7, 6, 7, 5],
[7, 5, 6, 5],
[6, 5, 6, 4],
[6, 4, 7, 4],
[7, 4, 7, 3],
[7, 3, 7, 2],
[7, 2, 6, 2],
[6, 2, 6, 3],
[6, 3, 5, 3],
[5, 3, 4, 3],
[4, 3, 4, 2],
[4, 2, 5, 2],
[5, 2, 5, 1],
[5, 1, 4, 1],
[4, 1, 4, 0],
[4, 0, 5, 0],
[5, 0, 6, 0],
[6, 0, 6, 1],
[6, 1, 7, 1],
[7, 1, 7, 0]])
elif choice == 2: # Zigzag
return np.array([[0, 0, 0, 1],
[0, 1, 0, 2],
[0, 2, 0, 3],
[0, 3, 0, 4],
[0, 4, 0, 5],
[0, 5, 0, 6],
[0, 6, 0, 7],
[0, 7, 1, 7],
[1, 7, 1, 6],
[1, 6, 1, 5],
[1, 5, 1, 4],
[1, 4, 1, 3],
[1, 3, 1, 2],
[1, 2, 1, 1],
[1, 1, 1, 0],
[1, 0, 2, 0],
[2, 0, 2, 1],
[2, 1, 2, 2],
[2, 2, 2, 3],
[2, 3, 2, 4],
[2, 4, 2, 5],
[2, 5, 2, 6],
[2, 6, 2, 7],
[2, 7, 3, 7],
[3, 7, 3, 6],
[3, 6, 3, 5],
[3, 5, 3, 4],
[3, 4, 3, 3],
[3, 3, 3, 2],
[3, 2, 3, 1],
[3, 1, 3, 0],
[3, 0, 4, 0],
[4, 0, 4, 1],
[4, 1, 4, 2],
[4, 2, 4, 3],
[4, 3, 4, 4],
[4, 4, 4, 5],
[4, 5, 4, 6],
[4, 6, 4, 7],
[4, 7, 5, 7],
[5, 7, 5, 6],
[5, 6, 5, 5],
[5, 5, 5, 4],
[5, 4, 5, 3],
[5, 3, 5, 2],
[5, 2, 5, 1],
[5, 1, 5, 0],
[5, 0, 6, 0],
[6, 0, 6, 1],
[6, 1, 6, 2],
[6, 2, 6, 3],
[6, 3, 6, 4],
[6, 4, 6, 5],
[6, 5, 6, 6],
[6, 6, 6, 7],
[6, 7, 7, 7],
[7, 7, 7, 6],
[7, 6, 7, 5],
[7, 5, 7, 4],
[7, 4, 7, 3],
[7, 3, 7, 2],
[7, 2, 7, 1],
[7, 1, 7, 0]])
elif choice == 3: # Circle
return np.array([[0, 0, 1, 0],
[1, 0, 2, 0],
[2, 0, 3, 0],
[3, 0, 4, 0],
[4, 0, 5, 0],
[5, 0, 6, 0],
[6, 0, 7, 0],
[7, 0, 7, 1],
[7, 1, 7, 2],
[7, 2, 7, 3],
[7, 3, 7, 4],
[7, 4, 7, 5],
[7, 5, 7, 6],
[7, 6, 7, 7],
[7, 7, 6, 7],
[6, 7, 5, 7],
[5, 7, 4, 7],
[4, 7, 3, 7],
[3, 7, 2, 7],
[2, 7, 1, 7],
[1, 7, 0, 7],
[0, 7, 0, 6],
[0, 6, 0, 5],
[0, 5, 0, 4],
[0, 4, 0, 3],
[0, 3, 0, 2],
[0, 2, 0, 1],
[0, 1, 1, 1],
[1, 1, 2, 1],
[2, 1, 3, 1],
[3, 1, 4, 1],
[4, 1, 5, 1],
[5, 1, 6, 1],
[6, 1, 6, 2],
[6, 2, 6, 3],
[6, 3, 6, 4],
[6, 4, 6, 5],
[6, 5, 6, 6],
[6, 6, 5, 6],
[5, 6, 4, 6],
[4, 6, 3, 6],
[3, 6, 2, 6],
[2, 6, 1, 6],
[1, 6, 1, 5],
[1, 5, 1, 4],
[1, 4, 1, 3],
[1, 3, 1, 2],
[1, 2, 2, 2],
[2, 2, 3, 2],
[3, 2, 4, 2],
[4, 2, 5, 2],
[5, 2, 5, 3],
[5, 3, 5, 4],
[5, 4, 5, 5],
[5, 5, 4, 5],
[4, 5, 3, 5],
[3, 5, 2, 5],
[2, 5, 2, 4],
[2, 4, 2, 3],
[2, 3, 3, 3],
[3, 3, 4, 3],
[4, 3, 4, 4],
[4, 4, 3, 4]])
elif choice == 4:
return np.array([
[0, 0, 1, 0],
[1, 0, 0, 1],
[0, 1, 1, 1],
[1, 1, 2, 0],
[2, 0, 3, 0],
[3, 0, 2, 1],
[2, 1, 3, 1],
[3, 1, 0, 2],
[0, 2, 1, 2],
[1, 2, 0, 3],
[0, 3, 1, 3],
[1, 3, 2, 2],
[2, 2, 3, 2],
[3, 2, 2, 3],
[2, 3, 3, 3],
[3, 3, 4, 0],
[4, 0, 5, 0],
[5, 0, 4, 1],
[4, 1, 5, 1],
[5, 1, 6, 0],
[6, 0, 7, 0],
[7, 0, 6, 1],
[6, 1, 7, 1],
[7, 1, 4, 2],
[4, 2, 5, 2],
[5, 2, 4, 3],
[4, 3, 5, 3],
[5, 3, 6, 2],
[6, 2, 7, 2],
[7, 2, 6, 3],
[6, 3, 7, 3],
[7, 3, 0, 4],
[0, 4, 1, 4],
[1, 4, 0, 5],
[0, 5, 1, 5],
[1, 5, 2, 4],
[2, 4, 3, 4],
[3, 4, 2, 5],
[2, 5, 3, 5],
[3, 5, 0, 6],
[0, 6, 1, 6],
[1, 6, 0, 7],
[0, 7, 1, 7],
[1, 7, 2, 6],
[2, 6, 3, 6],
[3, 6, 2, 7],
[2, 7, 3, 7],
[3, 7, 4, 4],
[4, 4, 5, 4],
[5, 4, 4, 5],
[4, 5, 5, 5],
[5, 5, 6, 4],
[6, 4, 7, 4],
[7, 4, 6, 5],
[6, 5, 7, 5],
[7, 5, 4, 6],
[4, 6, 5, 6],
[5, 6, 4, 7],
[4, 7, 5, 7],
[5, 7, 6, 6],
[6, 6, 7, 6],
[7, 6, 6, 7],
[6, 7, 7, 7]])
raise ValueError("Invalid choice")
if __name__ == "__main__":
user_choice = get_user_choice()
if not user_choice:
plot = InteractivePlot()
plot.run()
lines_array = plot.get_lines()
print(lines_array)
else:
lines_array = generate_lines_array(user_choice)
points, distances = calculate_distances(lines_array)
plot_heatmap(points, distances)
plot_heatmap_b(lines_array)
Output: ReLinked GNCs
Step 4: 数据结构转换
Input: ReLinked GNCs
Target: 转化成庭頫那边的输入,即连接子图的资源描述,庭頫这边可以看看还有什么要补充的。
Output:
- 子图描述,内含:
- 连接图数量
- 子图连接关系
- 到达事件 \ _____\ 这两者应该不是由我的程序产生,但是可以
- 离开事件 /  ̄ ̄/ 从我这里传进来
- eg.

子图权重参数基地址直接用id(varaible)就能取到
- 子图数据,内含:
最后认为我们应该共享一下各自定义的类(class),这样会比较明白互相之间需要什么参数
我目前定义的class如下:
