Thoughts on Mapping SNN to NH(3)
为什么簇排序(clustering)在映射(mapping)过程中如此重要呢?
神经元通常只与附近的少数其他神经元连接,而不是在整个网络中广泛连接。因此,找到好的簇的空间排列方式有助于将具有连接关系的神经元映射到二维空间中的相近位置,以减少长度和延迟。
目前,对于这一目标,有一种观点是采用某种空间填充曲线,原因在于:
1.局部性:部分空间填充曲线,如Hilbert Space Filling Curve(HSC), 具有较为优秀的局部性(locality),即在一维空间中彼此靠近的两个点在映射到二维空间后也会彼此靠近。不同的空间填充曲线之间的局部性之间存在较大的差异。
希尔伯特曲线演示:
希尔伯特3D曲线演示: 3D Hilbert Curves演示。
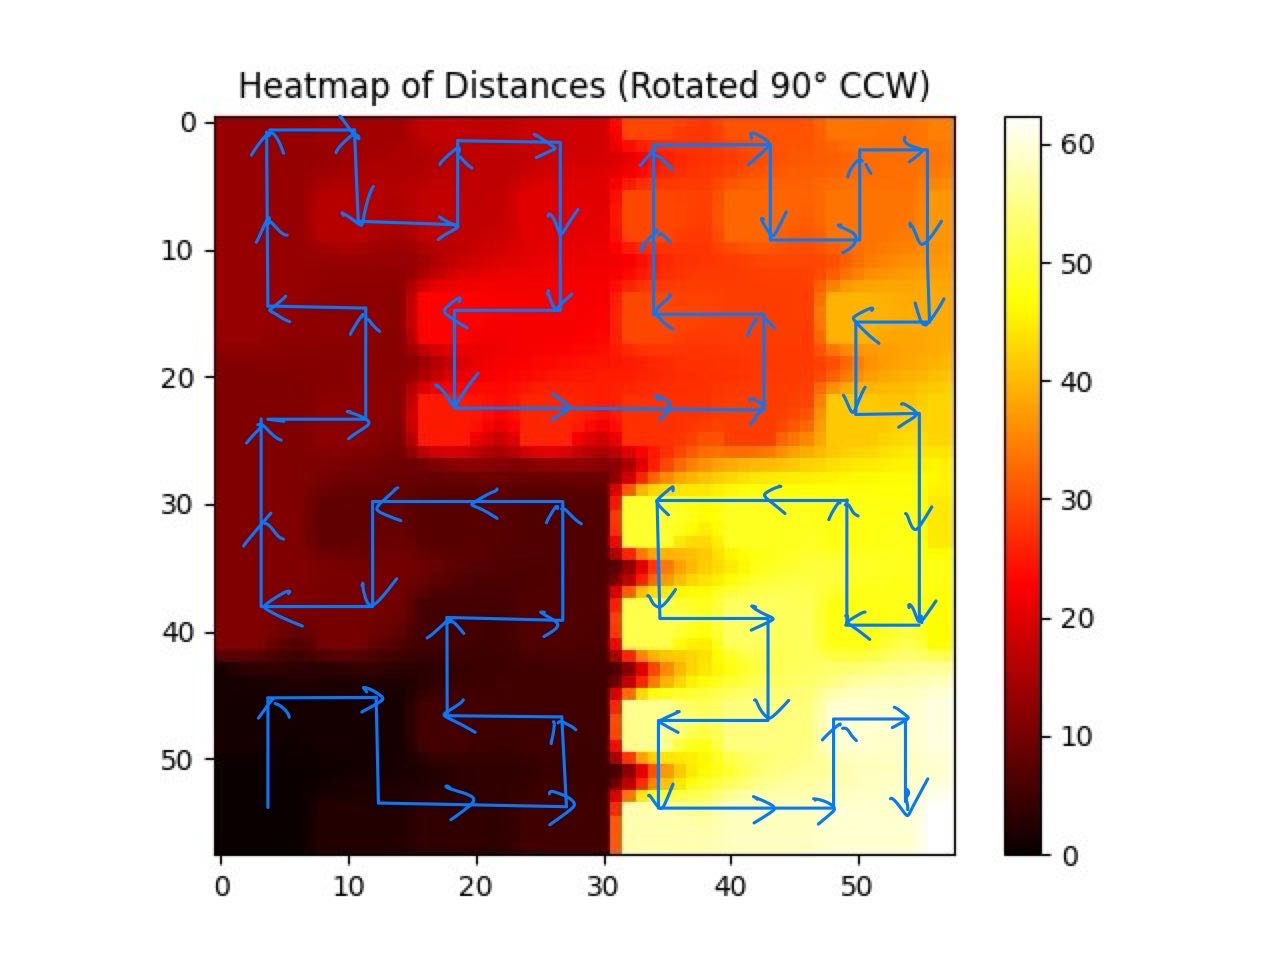
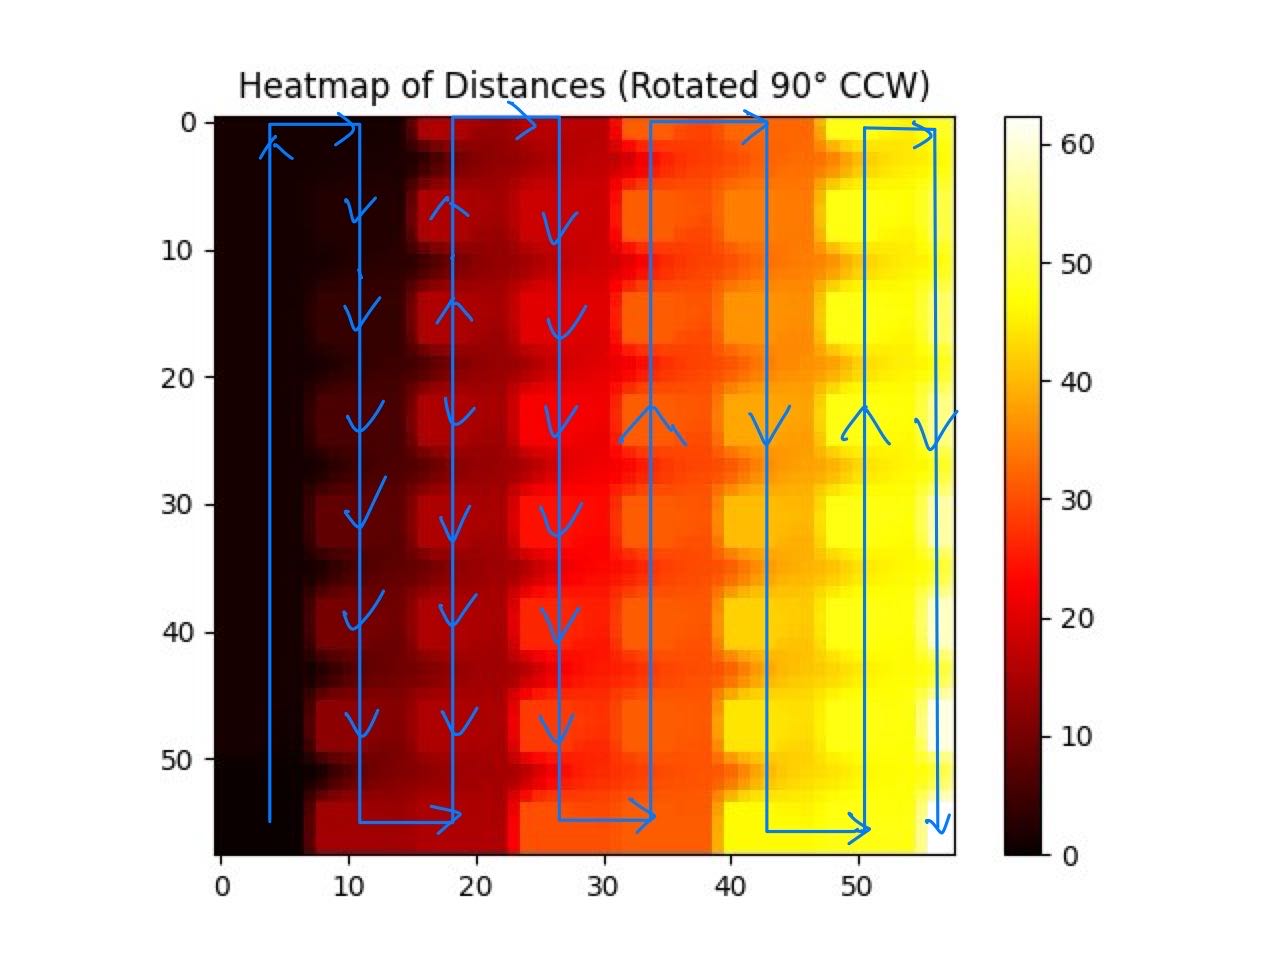
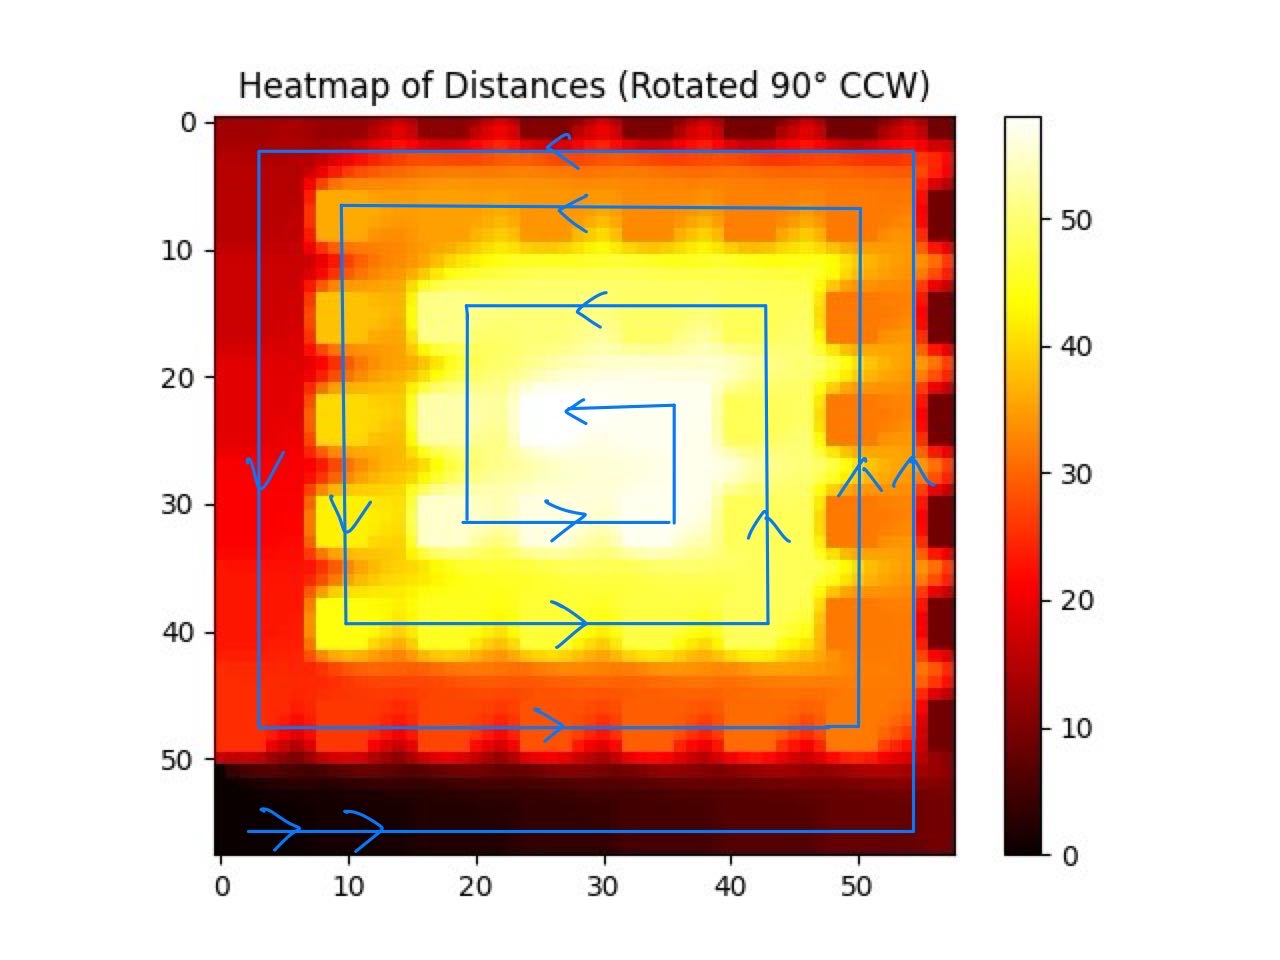
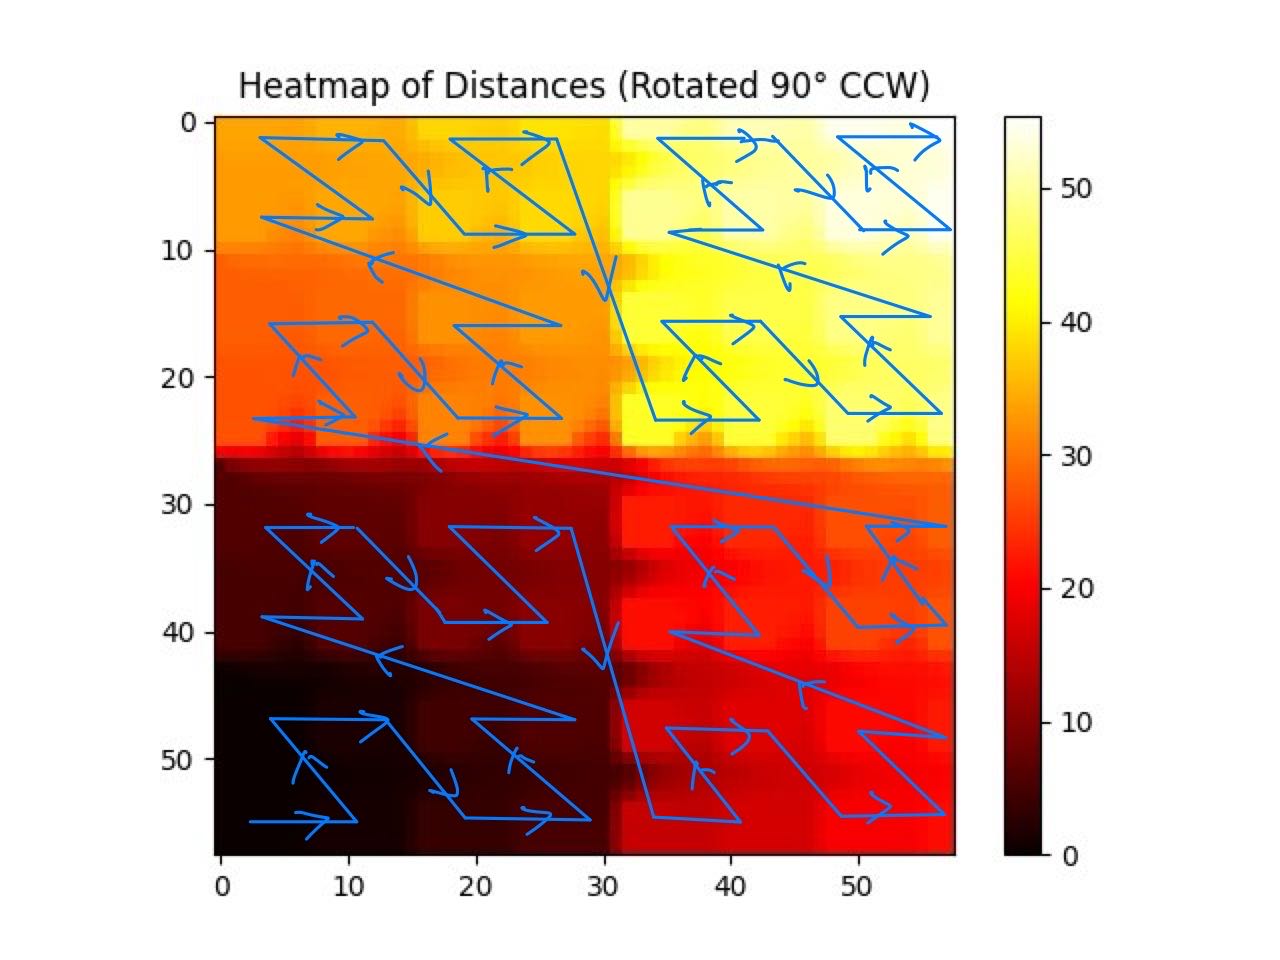
下面四张图分别是HSC, ZigZag Curve, Circle(Onion) Curve 及 Z-order Curve 将 y=0 这条直线进行翻折以填充一个8x8的二维空间时,生成的新点(x’,y’)到原始点(0,y)的距离构成的热力图。距离原始点越近,则颜色越深。
根据上面的图像,生成了四幅新图。在每一幅图中,(x,y)的值为从对应前一张图中随机抽取的Px, Py 两点之间的距离,并根据此生成的热力图
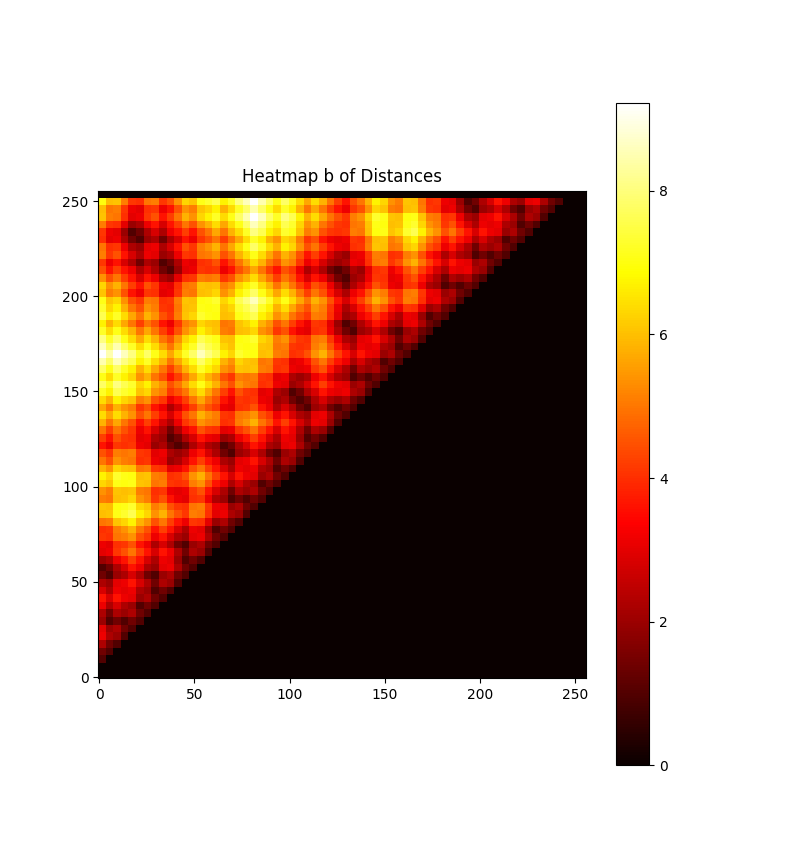
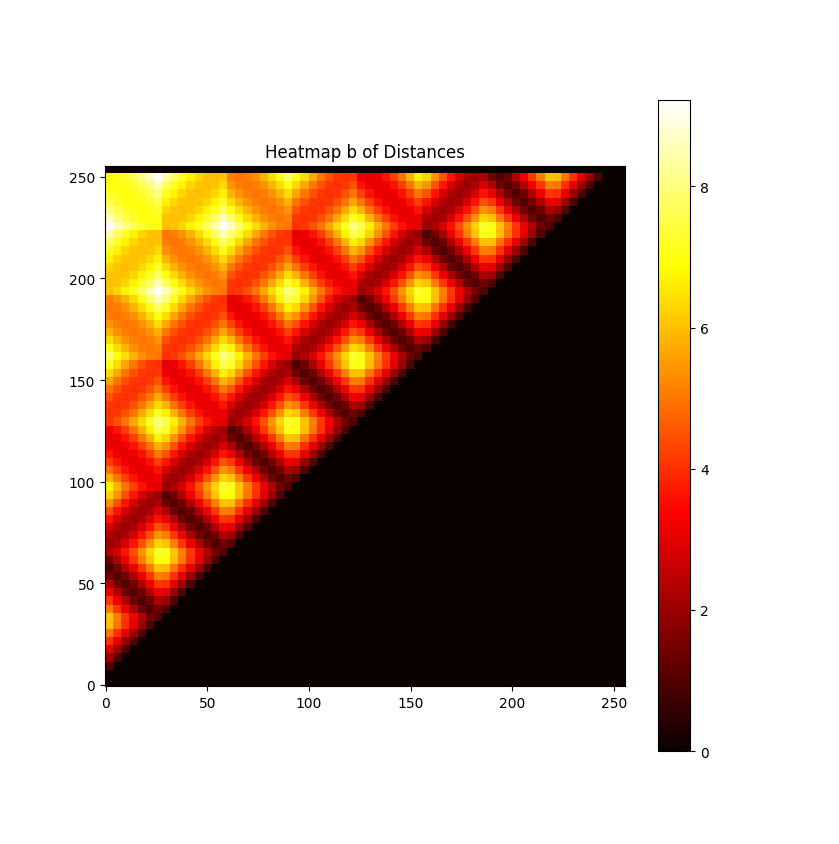
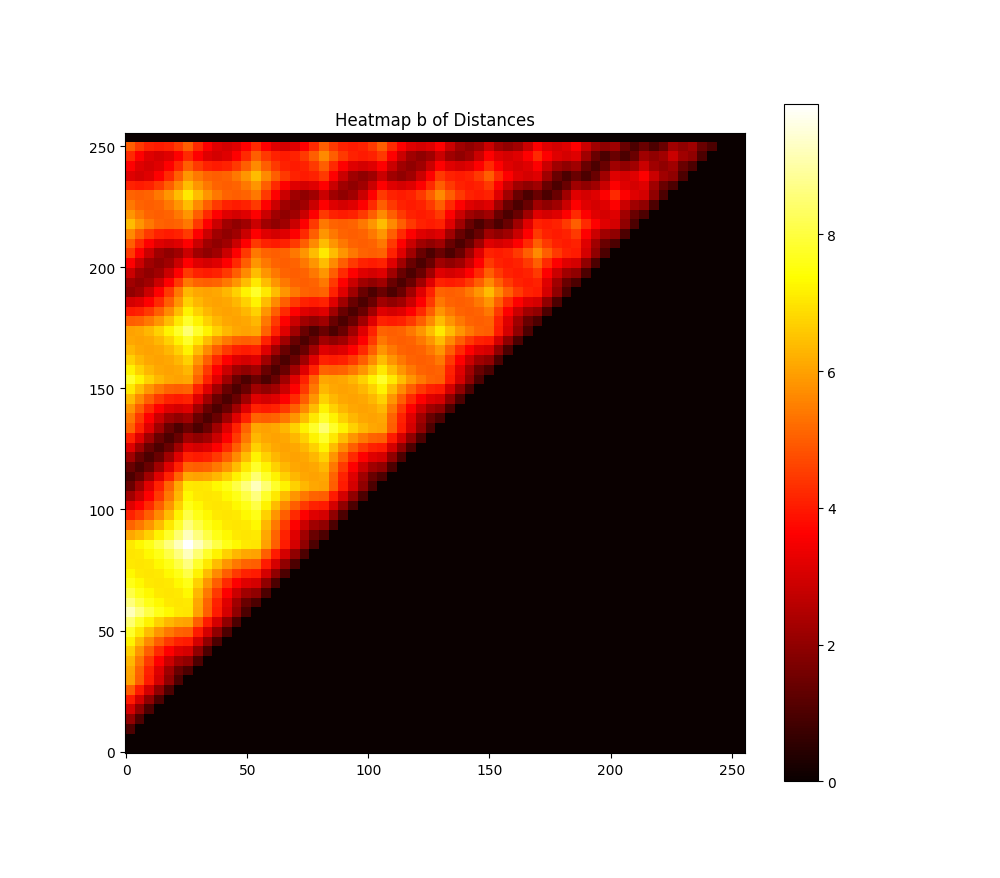
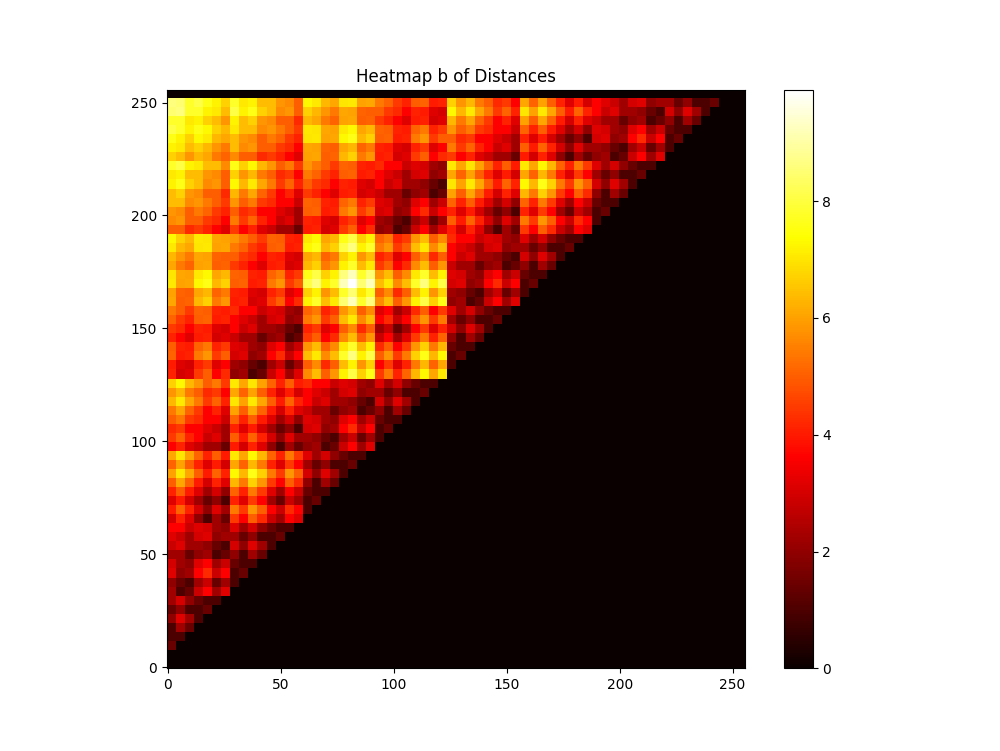
对于一个未知的SNN,我们生成一个概率云图,该云图为许多目前已知SNNs训练而成。将云图作为一个掩码(mask)与上面四幅新图相加,得到Cost。比较Cost即可得出最佳的空间填充曲线。
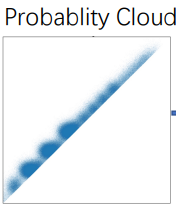
经过计算后,可以得到目前HSC其它空间填充曲线得到的Cost低,因而采用HSC。
该比较方法出自Mapping very large scale spiking neuron network to neuromorphic hardware
下文是从数学方面比较HSC和另一常见空间曲线Z-Order Curve特性的论文,并论证了HSC的局部性比z-Order更佳。
Clustering Analyses of Two-Dimensional Space-Filling Curves: Hilbert and z-Order Curves
需要注意的是: Locality的优劣并不能单独决定一个空间填充的好坏,事实上,Circle(Onion) Curve的Locality更加优秀,然而在上面的评估中,由于概率云的叠加,Circle Curve表现比HSC差。但是反过来说,有可能存在Locality不如HSC的空间填充曲线,在评估中表现却更佳。
2.无穷性:空间填充曲线可以通过无限迭代填充一个二维空间。也就是可以提供任意大小的二维空间与一维空间之间的映射,这意味着在将非常大规模的SNN应用映射到硬件时不会出现扩展性问题。
下文是一篇关于如何将HCS应用到非2n矩形空间的论文
Modified Hilbert Curve for Rectangles and Cuboids.pdf
3.方向性: 在经过拓扑排序后的簇序列中,数据流从输入端到输出端像水流一样具有方向性。而大部分空间填充曲线在映射过程中保持了这种方向性。并且,大部分空间填充曲线是分形图,这意味着它们在任何它们的子图中都具有这种特性。因此,不仅在全局范围内,而且在任何小局部区域,这种特性都有助于获得更好的布局。
Appendix
附上生成以上图像的代码
import matplotlib.pyplot as plt
import numpy as np
class InteractivePlot:
def __init__(self, grid_size=8):
self.grid_size = grid_size
self.fig, self.ax = plt.subplots()
self.points = np.array([(i, j) for i in range(grid_size) for j in range(grid_size)])
self.lines = []
self.temp_line = None
self.cid = self.fig.canvas.mpl_connect('button_press_event', self.onclick)
def plot_grid(self):
self.ax.plot(self.points[:, 0], self.points[:, 1], 'o', color='blue')
self.ax.set_xlim(-1, self.grid_size)
self.ax.set_ylim(-1, self.grid_size)
self.ax.set_aspect('equal')
plt.grid(True)
def onclick(self, event):
if event.inaxes != self.ax:
return
ix, iy = int(round(event.xdata)), int(round(event.ydata))
if self.temp_line is None:
self.temp_line = [ix, iy]
else:
self.temp_line.extend([ix, iy])
self.lines.append(self.temp_line)
self.ax.plot([self.temp_line[0], self.temp_line[2]],
[self.temp_line[1], self.temp_line[3]], 'r-')
self.fig.canvas.draw()
self.temp_line = None
def run(self):
self.plot_grid()
plt.show(block=True)
def get_lines(self):
return np.array(self.lines)
def calculate_distances(lines_array, grid_size=8):
num_points = grid_size * grid_size
points = np.zeros((num_points + 100, 2), dtype=int) # Add extra space for interpolated points
distances = np.full((num_points + 100,), np.inf) # Same here
points[0] = (0, 0)
distances[0] = 0
max_index = 0
for i, line in enumerate(lines_array):
points[i + 1] = (line[2], line[3])
distances[i + 1] = np.linalg.norm(np.array([0, i]) - points[i + 1])
max_index = i + 1 # store the max index used
# 计算线性插值
if i < len(lines_array) - 1:
next_point = (lines_array[i + 1][2], lines_array[i + 1][3])
for a in np.arange(0.25, 1, 0.25):
interp_point = points[i + 1] + a * (next_point - points[i + 1])
interp_index = i + 1 + int(a * 4)
if interp_index < len(distances): # Avoid out of bounds
distances[interp_index] = np.linalg.norm(np.array([0, i + a]) - interp_point)
max_index = max(max_index, interp_index) # Update max index
return points[:max_index + 1], distances[:max_index + 1] # Only return used points and distances
def plot_heatmap(points, distances, grid_size=8):
heatmap_size = 58
heatmap = np.full((heatmap_size, heatmap_size), np.inf)
# mapping to bigger grid
scale_factor = heatmap_size // (grid_size - 1)
for i, point in enumerate(points):
x, y = point * scale_factor
heatmap[x:x + 4, y:y + 4] = distances[i] # fill 4x5 grid
# interpolate the other grids
for x in range(heatmap_size):
for y in range(heatmap_size):
if np.isinf(heatmap[x, y]):
valid_neighbors = []
for dx in [-1, 0, 1]:
for dy in [-1, 0, 1]:
nx, ny = x + dx, y + dy
if 0 <= nx < heatmap_size and 0 <= ny < heatmap_size and not np.isinf(heatmap[nx, ny]):
valid_neighbors.append(heatmap[nx, ny])
if valid_neighbors:
heatmap[x, y] = np.mean(valid_neighbors)
# if not rotate
# plt.imshow(heatmap, cmap='hot', interpolation='nearest')
# plt.colorbar()
# plt.title("Heatmap of Distances")
# plt.show(block=True)
heatmap_rotated = np.rot90(heatmap)
plt.imshow(heatmap_rotated, cmap='hot', interpolation='nearest')
plt.colorbar()
plt.title("Heatmap of Distances (Rotated 90° CCW)")
plt.show(block=True)
def plot_heatmap_b(lines_array):
# Assuming lines_array is an Nx4 array, where N is the number of points, we only care about the x and y coordinates
grid_size = 256
heatmap = np.zeros((grid_size, grid_size))
num_points = len(lines_array)
for i in range(num_points):
for j in range(i):
# Get Px and Py
px = (lines_array[i][0], lines_array[i][1])
py = (lines_array[j][2], lines_array[j][3])
# Calculate Euclidean distance
distance = np.linalg.norm(np.array(px) - np.array(py), ord=2)
distance = np.round(distance, 5)
# Every point 4x4 grid
start_x, start_y = i * 4, j * 4
end_x, end_y = start_x + 4, start_y + 4
heatmap[start_x:end_x, start_y:end_y] = distance
# plot
plt.figure(figsize=(10, 10))
plt.imshow(heatmap, cmap='hot', interpolation='nearest')
plt.colorbar()
plt.title("Heatmap b of Distances")
plt.gca().invert_yaxis()
plt.show(block=True)
average_temperature = np.mean(heatmap)
print(f"The average temperature of the heatmap is: {average_temperature:.5f}")
def get_user_choice():
custom = input("Would you like to customize the lines data? (y/n): ")
if custom.lower() == 'n':
print("Select the default pattern:")
print("1: Hilbert Space Curve (HSC)")
print("2: Zigzag")
print("3: Circle")
print("4: Z-Order")
choice = input("Enter your choice (1, 2, 3, or 4): ")
return int(choice)
return 0
def generate_lines_array(choice):
if choice == 0: # Tester
return np.array([[0, 0, 1, 0]])
if choice == 1: # Hilbert Space Curve
# Placeholder for actual HSC points
return np.array([[0, 0, 0, 1],
[0, 1, 1, 1],
[1, 1, 1, 0],
[1, 0, 2, 0],
[2, 0, 3, 0],
[3, 0, 3, 1],
[3, 1, 2, 1],
[2, 1, 2, 2],
[2, 2, 3, 2],
[3, 2, 3, 3],
[3, 3, 2, 3],
[2, 3, 1, 3],
[1, 3, 1, 2],
[1, 2, 0, 2],
[0, 2, 0, 3],
[0, 3, 0, 4],
[0, 4, 1, 4],
[1, 4, 1, 5],
[1, 5, 0, 5],
[0, 5, 0, 6],
[0, 6, 0, 7],
[0, 7, 1, 7],
[1, 7, 1, 6],
[1, 6, 2, 6],
[2, 6, 2, 7],
[2, 7, 3, 7],
[3, 7, 3, 6],
[3, 6, 3, 5],
[3, 5, 2, 5],
[2, 5, 2, 4],
[2, 4, 3, 4],
[3, 4, 4, 4],
[4, 4, 5, 4],
[5, 4, 5, 5],
[5, 5, 4, 5],
[4, 5, 4, 6],
[4, 6, 4, 7],
[4, 7, 5, 7],
[5, 7, 5, 6],
[5, 6, 6, 6],
[6, 6, 6, 7],
[6, 7, 7, 7],
[7, 7, 7, 6],
[7, 6, 7, 5],
[7, 5, 6, 5],
[6, 5, 6, 4],
[6, 4, 7, 4],
[7, 4, 7, 3],
[7, 3, 7, 2],
[7, 2, 6, 2],
[6, 2, 6, 3],
[6, 3, 5, 3],
[5, 3, 4, 3],
[4, 3, 4, 2],
[4, 2, 5, 2],
[5, 2, 5, 1],
[5, 1, 4, 1],
[4, 1, 4, 0],
[4, 0, 5, 0],
[5, 0, 6, 0],
[6, 0, 6, 1],
[6, 1, 7, 1],
[7, 1, 7, 0]])
elif choice == 2: # Zigzag
return np.array([[0, 0, 0, 1],
[0, 1, 0, 2],
[0, 2, 0, 3],
[0, 3, 0, 4],
[0, 4, 0, 5],
[0, 5, 0, 6],
[0, 6, 0, 7],
[0, 7, 1, 7],
[1, 7, 1, 6],
[1, 6, 1, 5],
[1, 5, 1, 4],
[1, 4, 1, 3],
[1, 3, 1, 2],
[1, 2, 1, 1],
[1, 1, 1, 0],
[1, 0, 2, 0],
[2, 0, 2, 1],
[2, 1, 2, 2],
[2, 2, 2, 3],
[2, 3, 2, 4],
[2, 4, 2, 5],
[2, 5, 2, 6],
[2, 6, 2, 7],
[2, 7, 3, 7],
[3, 7, 3, 6],
[3, 6, 3, 5],
[3, 5, 3, 4],
[3, 4, 3, 3],
[3, 3, 3, 2],
[3, 2, 3, 1],
[3, 1, 3, 0],
[3, 0, 4, 0],
[4, 0, 4, 1],
[4, 1, 4, 2],
[4, 2, 4, 3],
[4, 3, 4, 4],
[4, 4, 4, 5],
[4, 5, 4, 6],
[4, 6, 4, 7],
[4, 7, 5, 7],
[5, 7, 5, 6],
[5, 6, 5, 5],
[5, 5, 5, 4],
[5, 4, 5, 3],
[5, 3, 5, 2],
[5, 2, 5, 1],
[5, 1, 5, 0],
[5, 0, 6, 0],
[6, 0, 6, 1],
[6, 1, 6, 2],
[6, 2, 6, 3],
[6, 3, 6, 4],
[6, 4, 6, 5],
[6, 5, 6, 6],
[6, 6, 6, 7],
[6, 7, 7, 7],
[7, 7, 7, 6],
[7, 6, 7, 5],
[7, 5, 7, 4],
[7, 4, 7, 3],
[7, 3, 7, 2],
[7, 2, 7, 1],
[7, 1, 7, 0]])
elif choice == 3: # Circle
return np.array([[0, 0, 1, 0],
[1, 0, 2, 0],
[2, 0, 3, 0],
[3, 0, 4, 0],
[4, 0, 5, 0],
[5, 0, 6, 0],
[6, 0, 7, 0],
[7, 0, 7, 1],
[7, 1, 7, 2],
[7, 2, 7, 3],
[7, 3, 7, 4],
[7, 4, 7, 5],
[7, 5, 7, 6],
[7, 6, 7, 7],
[7, 7, 6, 7],
[6, 7, 5, 7],
[5, 7, 4, 7],
[4, 7, 3, 7],
[3, 7, 2, 7],
[2, 7, 1, 7],
[1, 7, 0, 7],
[0, 7, 0, 6],
[0, 6, 0, 5],
[0, 5, 0, 4],
[0, 4, 0, 3],
[0, 3, 0, 2],
[0, 2, 0, 1],
[0, 1, 1, 1],
[1, 1, 2, 1],
[2, 1, 3, 1],
[3, 1, 4, 1],
[4, 1, 5, 1],
[5, 1, 6, 1],
[6, 1, 6, 2],
[6, 2, 6, 3],
[6, 3, 6, 4],
[6, 4, 6, 5],
[6, 5, 6, 6],
[6, 6, 5, 6],
[5, 6, 4, 6],
[4, 6, 3, 6],
[3, 6, 2, 6],
[2, 6, 1, 6],
[1, 6, 1, 5],
[1, 5, 1, 4],
[1, 4, 1, 3],
[1, 3, 1, 2],
[1, 2, 2, 2],
[2, 2, 3, 2],
[3, 2, 4, 2],
[4, 2, 5, 2],
[5, 2, 5, 3],
[5, 3, 5, 4],
[5, 4, 5, 5],
[5, 5, 4, 5],
[4, 5, 3, 5],
[3, 5, 2, 5],
[2, 5, 2, 4],
[2, 4, 2, 3],
[2, 3, 3, 3],
[3, 3, 4, 3],
[4, 3, 4, 4],
[4, 4, 3, 4]])
elif choice == 4:
return np.array([
[0, 0, 1, 0],
[1, 0, 0, 1],
[0, 1, 1, 1],
[1, 1, 2, 0],
[2, 0, 3, 0],
[3, 0, 2, 1],
[2, 1, 3, 1],
[3, 1, 0, 2],
[0, 2, 1, 2],
[1, 2, 0, 3],
[0, 3, 1, 3],
[1, 3, 2, 2],
[2, 2, 3, 2],
[3, 2, 2, 3],
[2, 3, 3, 3],
[3, 3, 4, 0],
[4, 0, 5, 0],
[5, 0, 4, 1],
[4, 1, 5, 1],
[5, 1, 6, 0],
[6, 0, 7, 0],
[7, 0, 6, 1],
[6, 1, 7, 1],
[7, 1, 4, 2],
[4, 2, 5, 2],
[5, 2, 4, 3],
[4, 3, 5, 3],
[5, 3, 6, 2],
[6, 2, 7, 2],
[7, 2, 6, 3],
[6, 3, 7, 3],
[7, 3, 0, 4],
[0, 4, 1, 4],
[1, 4, 0, 5],
[0, 5, 1, 5],
[1, 5, 2, 4],
[2, 4, 3, 4],
[3, 4, 2, 5],
[2, 5, 3, 5],
[3, 5, 0, 6],
[0, 6, 1, 6],
[1, 6, 0, 7],
[0, 7, 1, 7],
[1, 7, 2, 6],
[2, 6, 3, 6],
[3, 6, 2, 7],
[2, 7, 3, 7],
[3, 7, 4, 4],
[4, 4, 5, 4],
[5, 4, 4, 5],
[4, 5, 5, 5],
[5, 5, 6, 4],
[6, 4, 7, 4],
[7, 4, 6, 5],
[6, 5, 7, 5],
[7, 5, 4, 6],
[4, 6, 5, 6],
[5, 6, 4, 7],
[4, 7, 5, 7],
[5, 7, 6, 6],
[6, 6, 7, 6],
[7, 6, 6, 7],
[6, 7, 7, 7]])
raise ValueError("Invalid choice")
if __name__ == "__main__":
user_choice = get_user_choice()
if not user_choice:
plot = InteractivePlot()
plot.run()
lines_array = plot.get_lines()
print(lines_array)
else:
lines_array = generate_lines_array(user_choice)
points, distances = calculate_distances(lines_array)
plot_heatmap(points, distances)
plot_heatmap_b(lines_array)